
By monitoring industry trends you can make better strategic decisions. Especially right now, as the coronavirus vaccine rollout gains momentum and economic indicators seem both ominous and bright at the same time (a bit like a rainy day when the sun still manages to shine through), it’s critical that you pay attention to what’s happening from the 30,000 ft level as well as what’s happening in your neighborhood.
Stimulus measures have helped consumers and upended expectations for financial institutions. We looked at the data from Q4 of 2020 and examined how consumers and community financial institutions responded. Here's what we found.
What changed for consumers and their wallets?
Look at how consumers used their stimulus checks and how their behaviors contribute to larger economic trends. In 2020, 10.9 million Americans were unemployed and May of 2020 saw record unemployment claims. Fortunately, new claims fell steeply in Q4.
The U.S. government unleashed an unprecedented amount of fiscal and monetary support. The Federal Reserve Bank took unprecedented action to support the nation’s banks and credit unions.
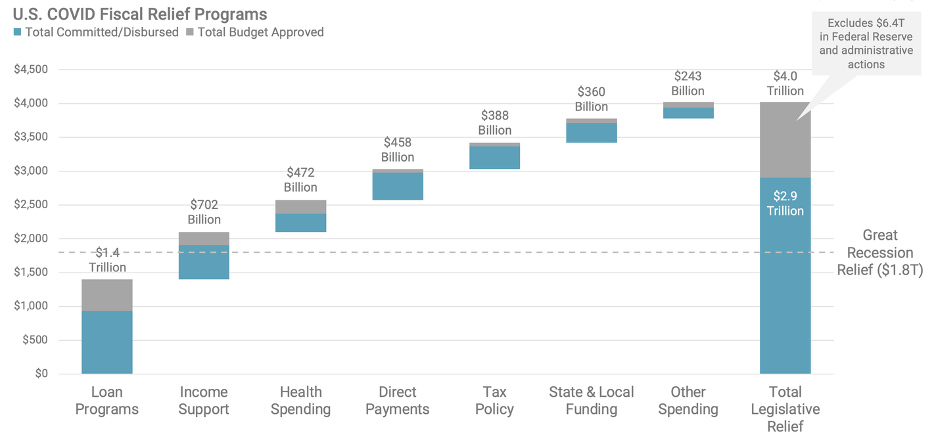
Source: Committee for a Responsible Budget; covidmoneytracker.org as of February 3, 2021.
The shutdown gave consumers financial whiplash.
Real gross domestic product plunged but rebounded significantly between Q2 and Q3 of 2020. The result was a more than 60% swing in the annual rate of change.
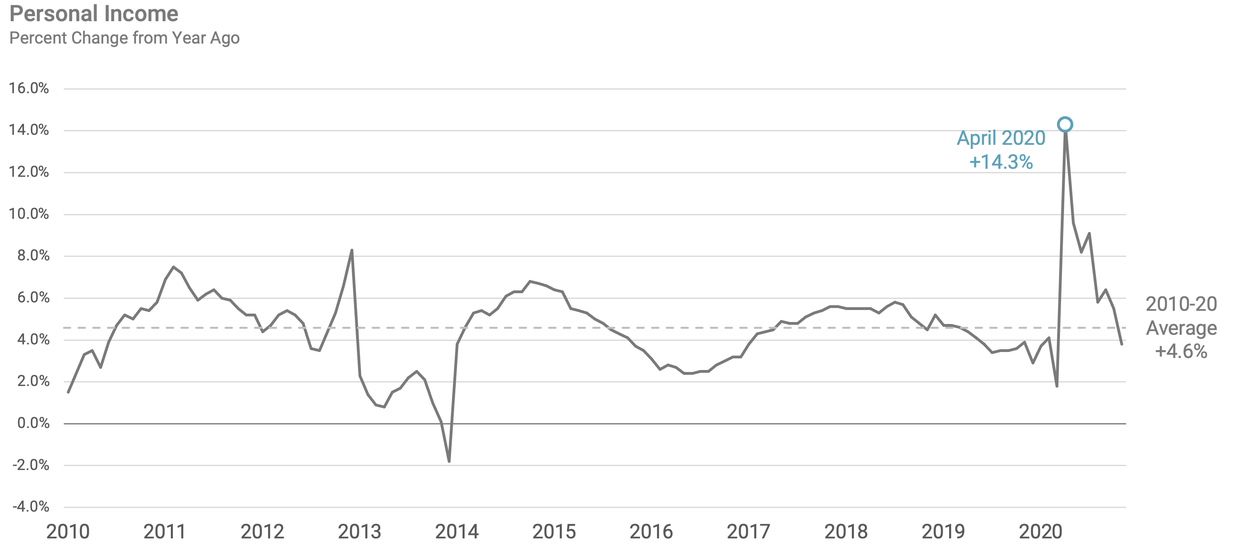
Direct household payments and unemployment aid caused personal incomes to soar to a peak of percent change from a year ago in April (14.3%), which was 4x the average of the prior 10 years (4.6%).
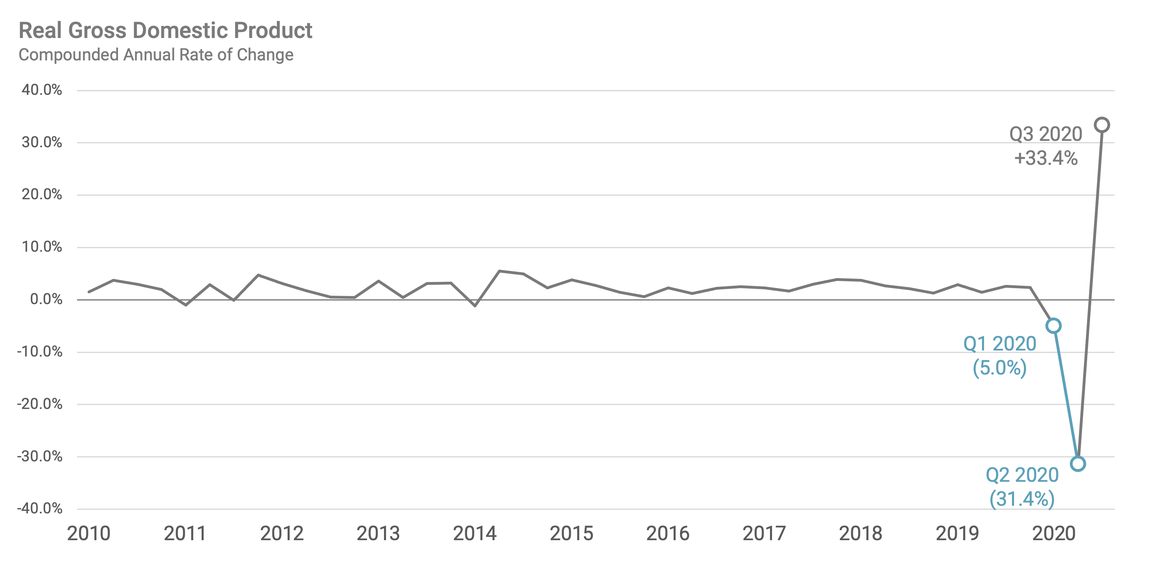
Source: U.S. Bureau of Economic Analysis.
Lower consumer spending and higher incomes resulted in a record high personal saving rate in April (33.7%) — 4x more compared to the prior 10 years average (8.1%).
Weekly point-of-sale swipes were down 3% for 2020 compared to 2019 but stabilized by Q3.
A more significant sign of depressed consumer spending is the fall in credit card lending for banks (-20.5%) and credit unions (-10.9%). In fact, many consumers used their stimulus funds to pay down credit card debt, presumably to prepare for the possibility that things might get worse.
Source: U.S. Bureau of Economic Analysis.
Only about 1 in 5 people receiving stimulus payments needed the relief for direct spending, contributing to a sharp increase in deposits and decline in consumer lending.

Source: Marketwatch
What does this mean for financial institutions?
The U.S. government supplied unprecedented fiscal and monetary support leading to record high deposit growth. In turn, banks and credit unions scrambled to support businesses and consumers.
Consumers paid down debts and saved more, reducing the need for borrowing more. However, many are refinancing debt to take advantage of low rates. This has contributed to the glut of deposits, but it has also positioned consumers to resume spending once their confidence rebounds.
It won't be like this forever. A persistent low-rate environment should help spur economic growth once restrictions are lifted, but multiple factors will determine how the recovery unfolds in 2021. The decisions you make today will be critical in positioning your institution for growth in the days ahead.
What changed for financial institutions and their balance sheets.
Community banks and credit unions saw waves of growth from two directions – first deposits, then loans. This resulted in a lot of balance sheets getting thrown out of whack. Leaders at financial institutions will be digesting the influx of assets and liabilities for an unknown amount of time.
Stimulus programs had the desired effect at a macro-level for banks and credit unions, although many continued to feel unsettled by challenges they faced in 2020.
Margin compression, reduced branch hours, relatively lower loan demand, and aggressive movement by neo-banks and megabanks have left many financial institutions unsure of the next right thing.
Many halted their marketing efforts due to uncertainty, a select few re-entered the fray, ready to reassure and serve consumers. These brave institutions positioned themselves for growth — but deposit growth needs to be paired with loan growth.
1. Assets grew steeply for banks and credit unions.
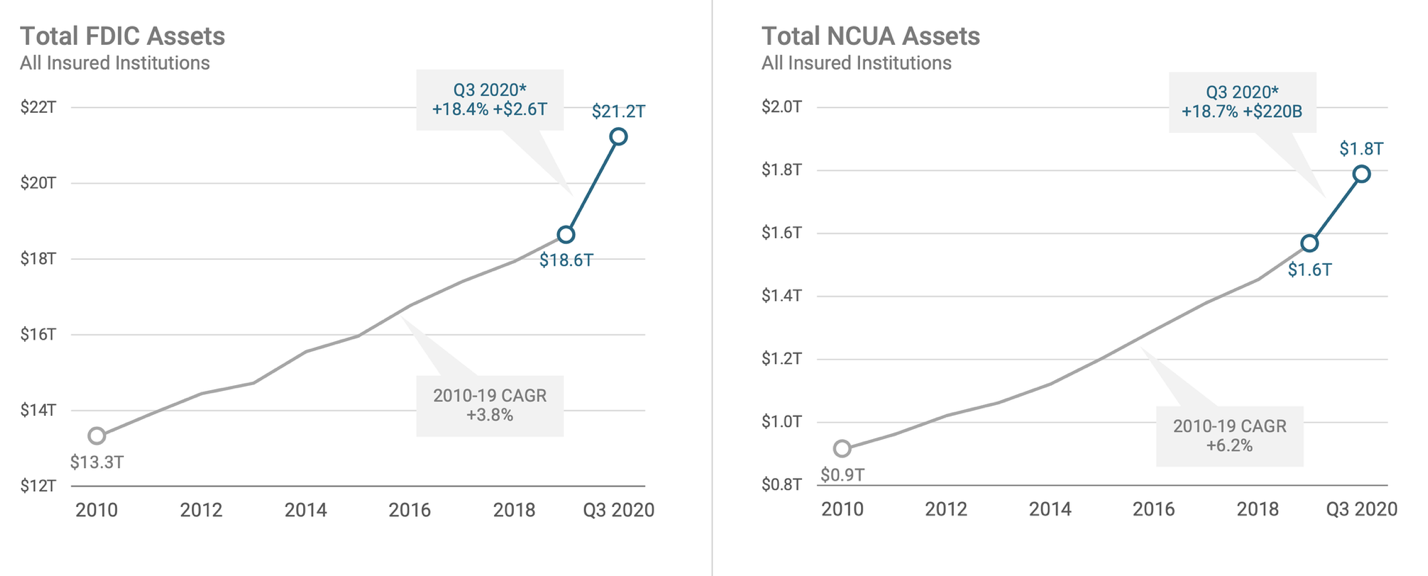
Source: FDIC & NCUA Quarterly Banking Profiles.
2. Counterintuitively, a surge in deposits led the asset growth.
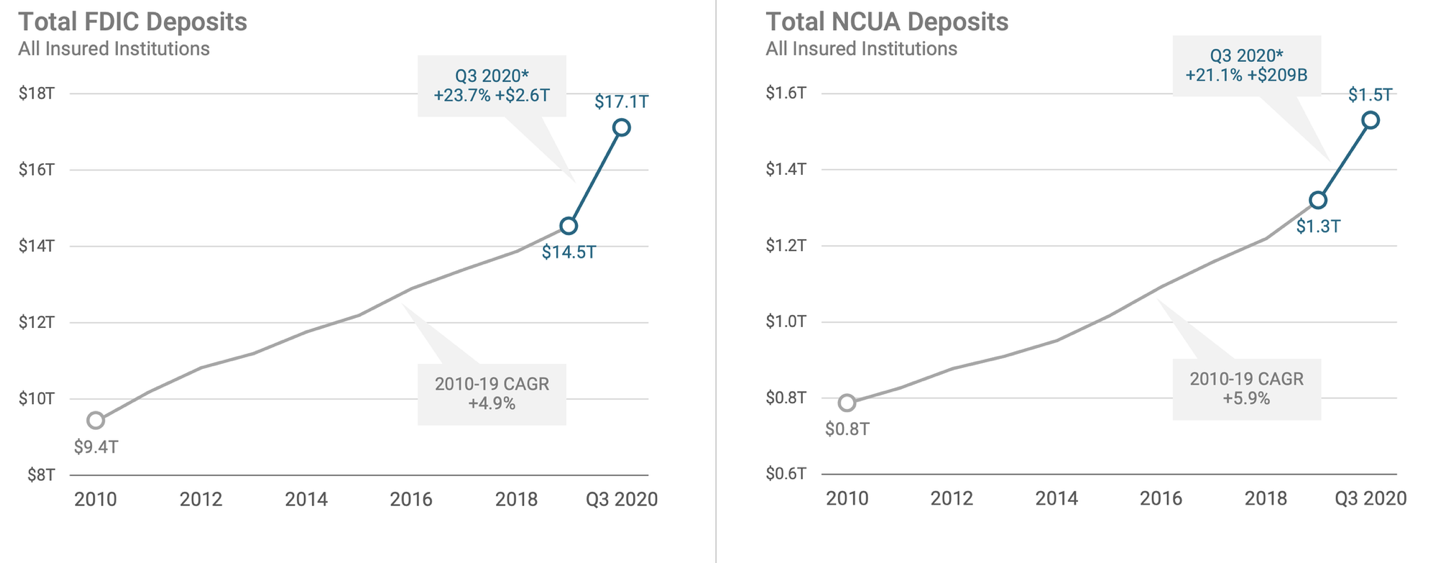
Source: FDIC & NCUA Quarterly Banking Profiles.
3. The largest financial institutions saw deposits grow at the highest rates during the pandemic.
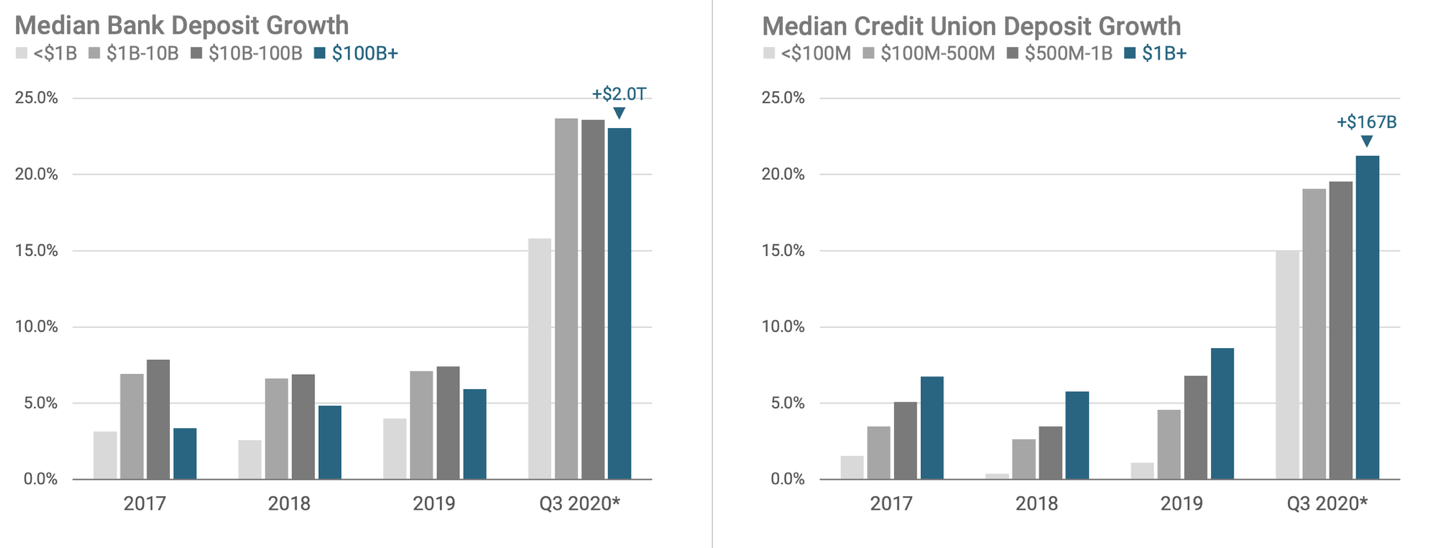
Source: FDIC & NCUA Call Reports; represents longitudinal analysis of all member institutions as of Q3 2020.
4. Middle market banks and large credit unions grew lending at the highest rates.
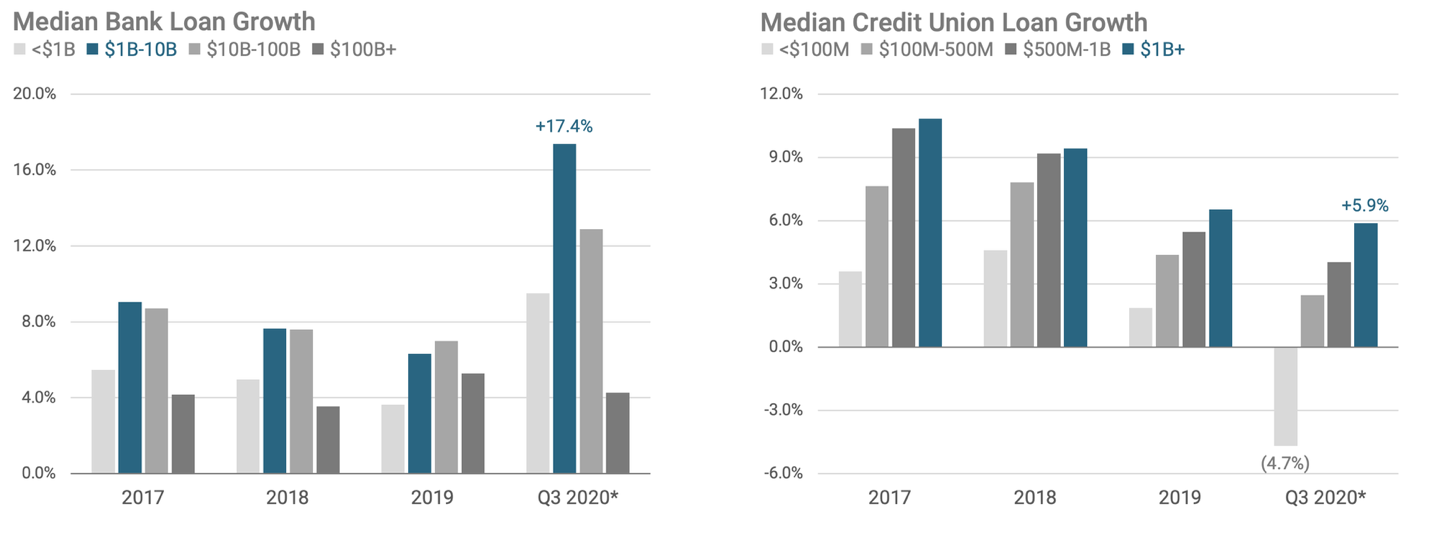
Source: FDIC & NCUA Call Reports; represents longitudinal analysis of all member institutions as of Q3 2020.
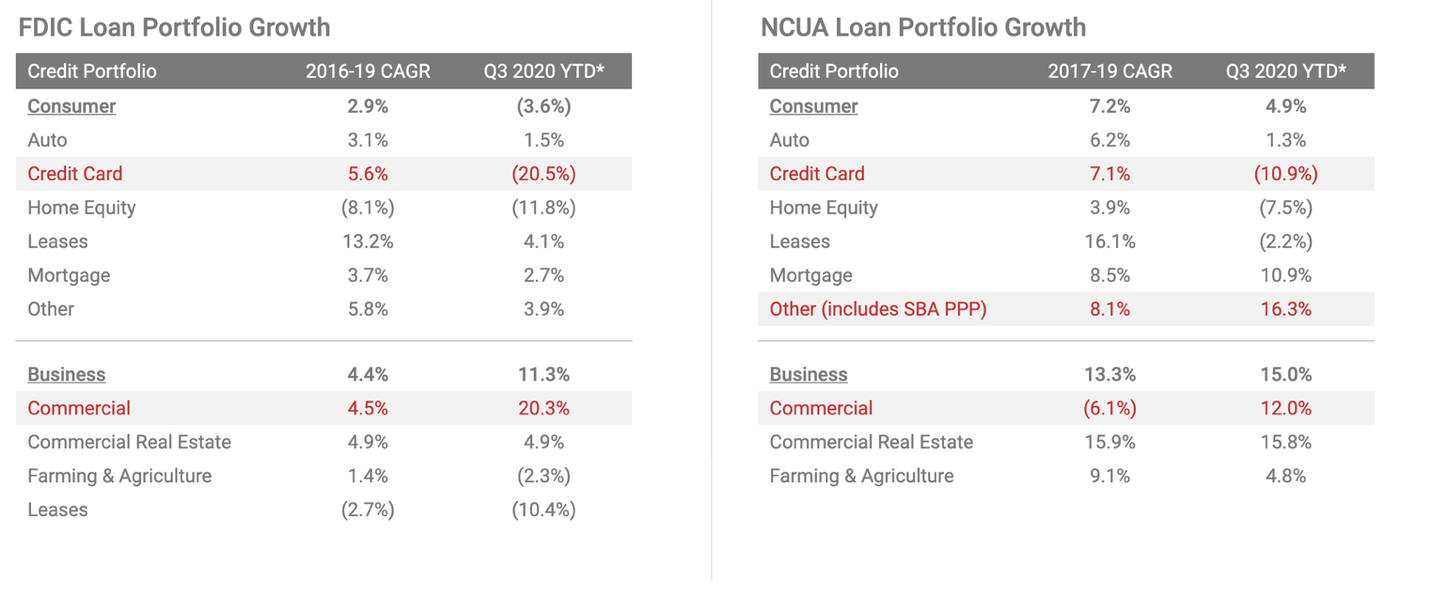
5. Business lending dominated bank and credit union portfolios as consumer lending stagnated.
Commercial lending at banks grew by 20.3%, and by 12.0% for credit unions in Q3. Credit card balances fell — consumers used their stimulus checks to pay them down.
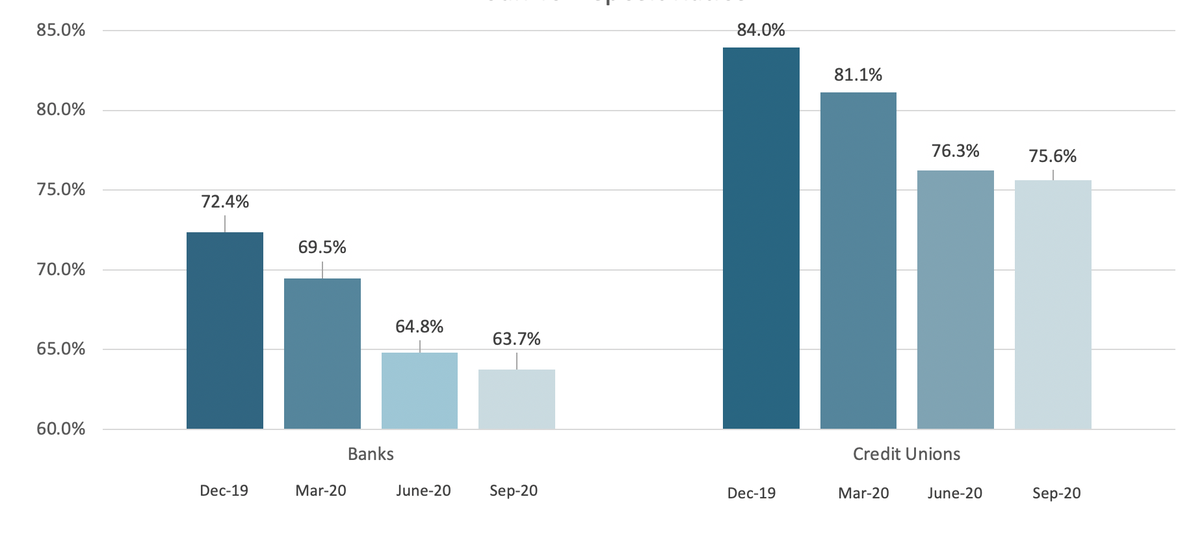
6. The “un-balanced sheet”
The financial industry faced a perfect storm: declining yields, excess liquidity, pandemic restrictions, and competition.
 Source: FDIC and NCUA Data
What does this mean for financial institutions?
The stimulus dollars and consumer changes have resulted in excess liquidity and project for further margin compression. The Federal Reserve Bank recommends that institutions cut expenses, focus on non-interest income, and grow loans — this advice is easier said than done.
Balance sheets won’t be upside down forever, but it could take time for this much stimulus to be "digested". Many smaller institutions find themselves struggling to make big strategic moves due to the burden of margin compression and expense reduction.
There has never been a better time for community banks and credit unions to connect with consumers and build profitable relationships. If your institution isn’t proactively communicating with consumers, you are likely to see a lot of account holders switch to a bank or credit union that does.
Why some financial institutions faring better than others.
Some institutions have outperformed their peers across a range of key metrics, and the reasons for their success could have implications for your next move. Thanks to a focus on the fundamentals of building relationships with consumers, a cohort of community financial institutions aren’t feeling the economic pain as acutely as others.
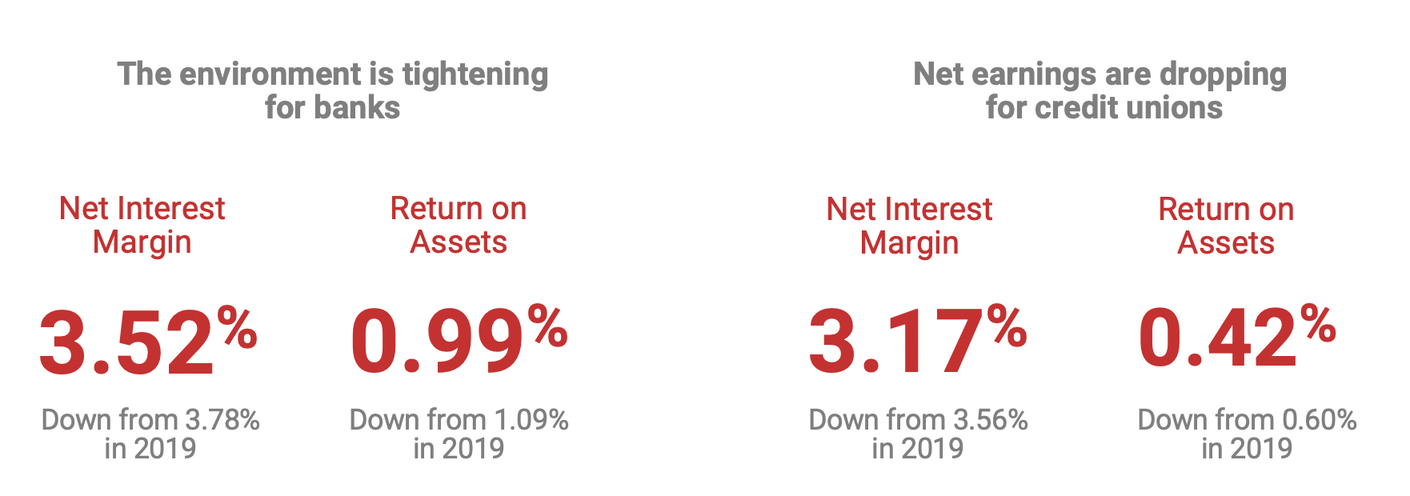
Banks offering Kasasa enjoyed a 3.68% Net Interest Margin (NIM) compared to 3.52% for all FDIC banks — Return on Assets was 1.03% compared to 0.99%. Credit unions offering Kasasa saw a NIM of 3.30% compared to 3.17% for all NCUA credit unions — Return on Assets was 0.43% compared to 0.42%.
Although Kasasa products are only one component of their success, the common denominator is worth noting: look for ways to meet consumers where they are with products and services they need. Once you’ve established trust, they’ll be more open to the rest of what your institution has to offer.
How does your performance compare?
Kasasa’s mission is to partner with locally owned financial institutions, who in turn help consumers and their communities. Our clients depend on us for accurate, strategic insights to help them perform so highly (it’s a mutual admiration society). Request your custom Market Benchmark Report to see how you stack up.
*Year-to-date growth rates are annualized.